Happy to release Xsemble 4.4 on this auspicious day today. Download it here.
We have added context-sensitive menus (commonly known as right-click menus or simply as popup menus) on an experimental basis in this release. In the Xsemble toolset, the graphs are very important in that they provide a visualization of the various design elements of a software. The intent of this change is to reduce the need for users to open the edit dialog boxes, as they can carry out most of their work on the graph.
This release also adds the visualization of implementation status colors. It is quite useful in tracking the progress of work, while a software is under development or maintenance.
New Context Sensitive Menus in Xsemble
Where do these menus appear? They appear when you right click on any node — in Developer’s Workbench, in Assembler’s Workbench and in Monitoring Workbench. They appear only for valid operations.
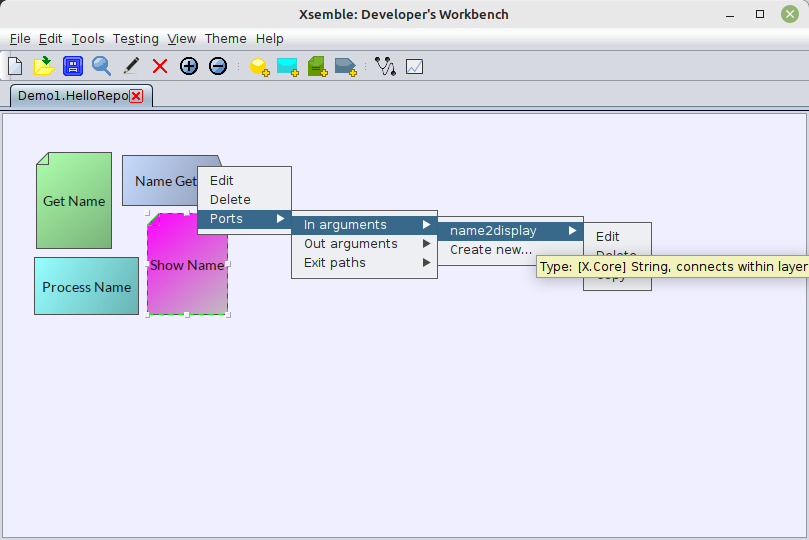
In Developer’s Workbench
In the Developer’s Workbench, you can use it for edit / delete the component as well as its ports. As the screenshot shows, a tooltip is also used to give more information when applicable.
One functionality that is expected to make one highly productive is the Copy/Paste. It can be used to quickly clone function arguments or exit paths, within the same component or across components. Here is how it works: You right click a component, navigate to its port that you want to use as a template, and click “Copy”. Then choose the “Paste” menu (in the appropriate port of the target component).
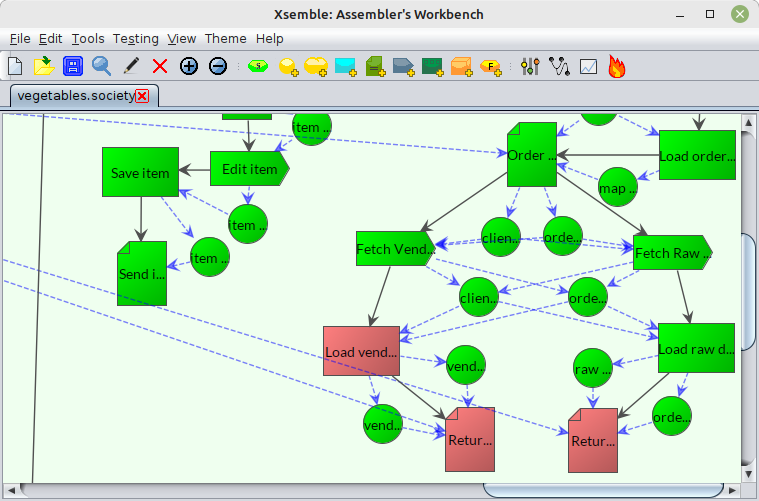
In Assembler’s Workbench
In the Assembler’s Workbench, the context menu is used for editing / deleting the node, navigating upstream / downstream and adding and removing connections. When the graphs become complex, the navigation is an important use case. An example is shown below.

Making connections is an important use case. The new Connect / Disconnect menus give you the visual editing of the connections, while fully being compliant with the underlying complexity of modeling a software application.
- When you try to connect an open port, you see a floating “Connect” dialog appear on the screen.
- The nodes where a connection can be made are populated in the dropdown. If a node in the graph does not figure in the diagram, then it is not a candidate for making the connection based on the architectural layer that they belong to. (This is Xsemble preventing you from making a wrong connection.)
- The node that you select in the dropdown gets highlighted on the graph. On the other hand, if you click on a node in the graph, then that node gets selected in the dropdown (or you get an error if the node is not there).
- Once this visual selection is done, click “Connect” button to make the connection.
Sounds easy? It certainly is. Try it out.

The ability to make changes to the base component right from Assembler’s Workbench (as long as it is not sealed) is not present in the context-sensitive menus yet. We may add those later. For now, you may either achieve that via the edit dialog boxes, or navigating to the base component in the Developer’s Workbench and making changes there. All these operations are possible through the context sensitive menus.
In Monitoring Workbench
Finally, in the Monitoring Workbench, the context sensitive menus are used opening the view dialog and for pulling up the Monitoring report for the given node.
The main purpose of the context sensitive menus
Implementation Status Coloring
Beyond the context-sensitive menus, another important change is the implementation status coloring. Xsemble component implementations can be in either one of the 4 statuses:
- Unimplemented – the default initial status
- In progress – automatically set when you start adding business logic code to component implementations
- Stale – automatically set when implementation code changes are older than the component definition update
- Implemented – manually set when you conclude the work on the component and its implementation
When a project is ongoing, it is very useful in project tracking that we know what is the status of this implementation.
So far, this has been possible through the progress reports. The Kanban chart and the detailed progress report let you have a good visibility at the node level.
The new release takes this to a new level by using different colors for the states and showing those colors on the graph itself. The figure shows how some ‘Stale’ nodes are now easily identified on the graph, distinct from other ‘Implemented’ nodes. This is done in all the three tools — Developer’s Workbench, Assembler’s Workbench and the Monitoring Workbench.
Other Changes
There are a few other minor updates and bug fixes, especially in the Monitoring Workbench, in this release.